Americans’ collective credit card debt balance hit $930 billion in Q3 2022. That’s a $43 billion jump from the previous quarter. The average cardholder now has more than $6,000 in credit card debt, closing in on 2019’s all-time high.
But our debt burden isn’t equally shared. Most Americans have no credit card debt at all. Others have far more than $6,000. Certain demographic groups carry more credit card debt than others. Statistically speaking, middle-aged white Americans in coastal or Southern states have the most.
Though mortgages and home equity products account for a far greater share of total household debt, credit card debt punches above its weight. High-interest credit card balances sap purchasing power and weaken household finances, making it more difficult to get ahead. And with credit card interest rates the highest they’ve been in at least 30 years, even smaller balances are expensive to carry.
Find out why credit card debt is so important to the overall financial picture and see where you stand in relation to your fellow Americans.
Average Credit Card Debt: Key Findings
We spotted some interesting factoids, trends, and relationships as we combed through the latest data on U.S. credit card debt. Some highlights:
- Americans’ credit card balances are growing again after a brief downturn during the pandemic.
- 41% of all open credit card accounts carry balances, while 36% pay in full each month. The remainder (23%) are dormant.
- The average credit card user’s balance accounts for 4.72% of disposable income, up from 2020 but still below 2019 levels (~5.5%).
- The interest rate on interest-accruing credit card accounts is 18.43%, up from 14.44% in 2017. For every $1,000 in carried balances, that’s an additional $40 in annual interest.
- Subprime credit limits are falling, suggesting issuers have little confidence in the economic outlook.
- People over 75 have the highest mean credit card balance despite only 28% carrying any balance at all. That means significant financial strain for a relatively small group of seniors.
- People in expensive states have more credit card debt, with Alaska, Connecticut, New Jersey, and Maryland leading the pack.
- Higher-income people have more credit card debt, as do people who own their own homes.
- College graduates have more credit card debt on average than nongraduates, but a majority pay off their balances each month.
- More Black and Hispanic consumers carry credit card balances, but their average balances tend to be lower than white and Asian consumers’.
Where Did We Get This Data?
Unless otherwise noted, the data for this article came from:
- The Federal Reserve Bank of New York’s Quarterly Report on Household Debt and Credit (Q2 2022, released August 2022)
- The American Bankers Association’s Credit Market Monitor (Q1 2022, released August 2022)
- The Federal Reserve Board of Governors’ Survey of Consumer Finances (data through 2019)
- The Federal Reserve Board of Governors’ G.19 report (data through Q3 2022)
Mean vs. Median and Why It Matters
Next, a quick refresher on “mean” vs. “median.”
To find the mean of a set of values, add up each value in the set and divide by the number of values. So the mean of “3, 6, 8, 11, 15” is (3 + 6 + 8 + 11 + 15) / 5 = 8.6.
To calculate the median of a set with an odd number of values, find the middle number. The median of “3, 6, 8, 11, 15” is 8.
To calculate the median of a set with an even number of values, find the mean of the two middle numbers. The median of “3, 6, 8, 10, 11, 15” is 9.
The median is less sensitive to outlier values than the mean. So if you see that the mean of a particular data set is much higher than its median, that’s a clue that a relatively small number of unusually high values is skewing the mean.
Credit Card Debt Trends
The total U.S. credit card balance increased by $43 billion between Q2 and Q3 2022, to $930 billion. Here’s the U.S. credit card debt trendline for the past 25 years.
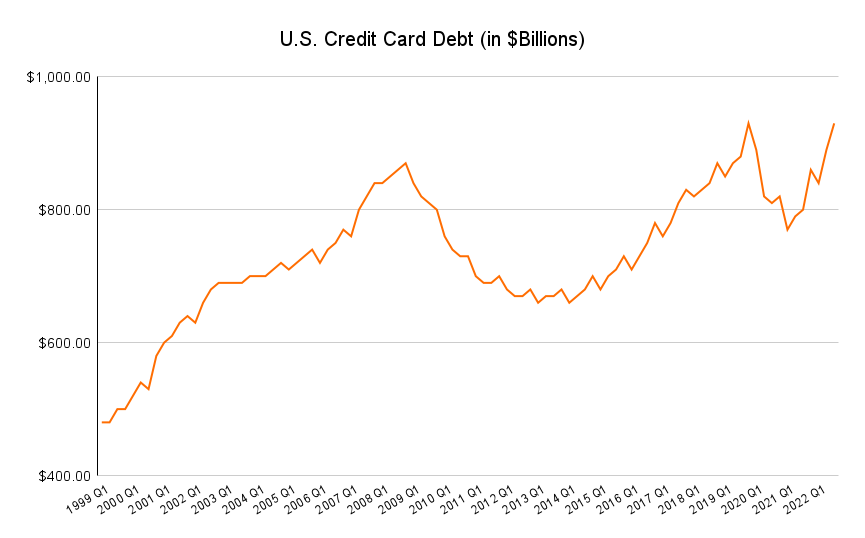
Looking back, we see credit card debt increase sharply in the late 1990s and early 2000s, from less than $500 billion in 1999 to around $700 billion in 2003. The trendline levels off in the mid-2000s before climbing again to a peak of nearly $900 billion in 2008, as the Great Recession loomed.
A long period of deleveraging follows. The bottom goes in around $650 billion in 2014, followed by a steady climb to near $950 billion in 2019. The sharp pandemic pullback in consumer spending drops total U.S. credit card debt below $800 billion by 2021, followed by an equally sharp rise back toward the 2019 high in 2022.
How Many Credit Card Accounts Are There?
According to the American Bankers Association (ABA), there were approximately 372 million credit card accounts open in Q1 2022, the most recent figure available.
How Fast Are People Opening New Credit Card Accounts?
The net number of U.S. credit card accounts increased by 4.4% since Q1 2021. But because this rate accounts for account closures as well, it understates how fast consumers opened new credit card accounts.
The rate of new account openings increased 6.4% from Q1 2021 to Q2 2022, driven largely by a surge in applications from subprime borrowers (people with impaired credit). The new account opening rate is now within 17% of its pre-pandemic highs and has clawed back most of its losses during the brief, sharp COVID recession.
What Is the Average Credit Line?
In Q1 2022, the average (mean) credit line across all accounts broke down as follows:
| Super-Prime (FICO > 720) | $12,097 |
| Prime (660 to 719) | $7,610 |
| Subprime (< 660) | $3,673 |
Credit card issuers tend to be more risk-averse with new cardholders, so the mean credit line is lower across the board for new accounts:
| Super-Prime | $9,216 |
| Prime | $5,013 |
| Subprime | $2,291 |
How Many People Carry Credit Card Debt?
The ABA divides credit card users into three groups:
- Transactors, who regularly use their cards but pay their balances off in full each month. They generally avoid interest charges.
- Revolvers, who carry balances from month to month. They’re the biggest money-making group for credit card issuers because they pay interest.
- Dormants, who don’t regularly use their cards. They keep their accounts open because they may plan to use them in the future, because they know it’s good for their credit scores, or because they’ve simply forgotten about them.
As of Q1 2022, Revolvers accounted for 40.9% of all open credit card accounts. Their share increased 0.8% over Q4 2021.
Transactors accounted for 35.5% of all open accounts, a 0.7% decline from the previous quarter. Dormants brought up the rear with 23.7%, essentially unchanged from Q4 2021.
How Much Credit Card Debt Do People Carry As a Share of Income?
Credit card debt as a percentage of disposable income rose 0.16% to 4.72% in Q1 2022. In other words, the average consumer’s credit card debt burden is nearly 5% of their income after accounting for nonnegotiable expenses like housing and taxes.
This figure declined abruptly in early 2020 and has only slowly crept back up. It’s still three-quarters of a point below pre-pandemic levels.
What’s the Average Credit Card Interest Rate?
According to the Federal Reserve Board of Governors’ G.19 report, the mean credit card interest rate on all accounts was 16.27% as of Sept. 2022. When including only those accounts charging interest, the mean rate climbs to 18.43%.
That’s up from 12.89% and 14.44%, respectively, in 2017. In other words, interest rates on accounts accruing interest have increased by about 400 basis points (4 percentage points) since then.
Analysis: What’s Behind the Numbers
What do these credit card trends tell us? Our takeaways:
- The Pandemic Drop in Credit Card Utilization Was a Blip, Not a New Normal. COVID stimulus is done. Households have largely reverted to pre-pandemic spending habits, boosting travel and restaurant spending. And the number of active credit card accounts carrying balances is rising as a result, from 51% in Q1 2021 to 54% in Q1 2022, per the latest figures from the American Bankers Association. We’re closing in on 60%, the recent pre-pandemic high.
- Consumers Are Leaning on Credit Cards More These Days. On top of the reversion to more normal spending levels and mix, the 8% annual inflation rate is squeezing household finances and driving up lower- and middle-income households’ credit card utilization. Prime and subprime consumers saw the biggest year-over-year increase (16% and 17%, respectively).
- Credit Card Issuers Remain Cautious, Especially in Subprime. Subprime account approvals jumped 33% between Q1 2021 and Q2 2022 while credit limits on subprime accounts fell by 0.2%. This suggests issuers are concerned about higher credit card spending by less creditworthy consumers, but they’re not panicking just yet.
Average Credit Card Debt by Demographic
Now that we understand the big-picture trends in U.S. credit card balances since the late 1990s, let’s dig into the demographic factors behind them. See how age, location, income, race and ethnicity, homeownership, and educational attainment relate to credit card debt.
Average Credit Card Debt By Age
The typical person’s total credit card balance increases during the first half of adulthood. So does their likelihood of carrying credit card debt at all.
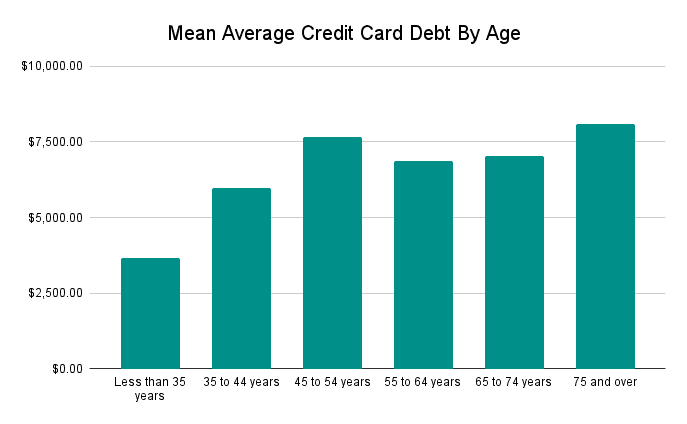
People under age 35 have a mean credit card debt load of $3,660. Their median credit card debt load is $1,900. 47.6% of under-35 adults have any credit card debt at all.
The mean 45-to-54-year-old has $7,670 in carried credit card balances. The median for this age group is $3,200. Nearly 52% carry balances — the highest proportion of any age group.
What about over-75s? This group’s mean credit card debt is a whopping $8,080, but the median is just $2,700. Only 28% of consumers over age 75 have any credit card debt at all.
| Mean | Median | Percentage Who Carry Debt | |
| Less than 35 years | $3,660.00 | $1,900.00 | 47.6% |
| 35 to 44 years | $5,990.00 | $2,700.00 | 50.5% |
| 45 to 54 years | $7,670.00 | $3,200.00 | 51.7% |
| 55 to 64 years | $6,880.00 | $3,000.00 | 46.6% |
| 65 to 74 years | $7,030.00 | $2,850.00 | 41.1% |
| 75 and over | $8,080.00 | $2,700.00 | 28% |
Average Credit Card Debt By State
At $6,617 per person, Alaskans have the highest mean credit card debt. The only other state in the $6,000 club is Connecticut, with $6,052 per person.
Other states with high credit card debt burdens include Virginia, New Jersey, Maryland, Texas, Georgia, the District of Columbia (an honorary state for our purposes), Florida, Hawaii, and Colorado. The mean credit card balance per person exceeds $5,500 in each of these states.
| State | Average Credit Card Debt (Q3 2021) |
| Alaska | $6,617 |
| Connecticut | $6,052 |
| New Jersey | $5,995 |
| District of Columbia | $5,949 |
| Maryland | $5,911 |
| Virginia | $5,864 |
| Texas | $5,820 |
| Florida | $5,620 |
| Georgia | $5,604 |
| Colorado | $5,587 |
| Hawaii | $5,525 |
| New York | $5,473 |
| Nevada | $5,373 |
| Delaware | $5,357 |
| Illinois | $5,315 |
| New Hampshire | $5,251 |
| Massachusetts | $5,232 |
| Washington | $5,231 |
| South Carolina | $5,176 |
| Wyoming | $5,159 |
| Oklahoma | $5,155 |
| California | $5,154 |
| Rhode Island | $5,153 |
| North Carolina | $5,101 |
| Arizona | $5,061 |
| Louisiana | $5,054 |
| Kansas | $5,029 |
| Pennsylvania | $5,026 |
| Tennessee | $4,891 |
| Alabama | $4,875 |
| North Dakota | $4,874 |
| Missouri | $4,865 |
| Utah | $4,831 |
| New Mexico | $4,821 |
| Ohio | $4,808 |
| Nebraska | $4,789 |
| Montana | $4,778 |
| Minnesota | $4,754 |
| Arkansas | $4,670 |
| Michigan | $4,661 |
| Oregon | $4,630 |
| Vermont | $4,595 |
| South Dakota | $4,591 |
| West Virginia | $4,574 |
| Idaho | $4,539 |
| Maine | $4,538 |
| Mississippi | $4,449 |
| Kentucky | $4,408 |
| Wisconsin | $4,329 |
| Iowa | $4,285 |
States With the Highest Credit Card Debt
| State | Average Credit Card Debt (Q3 2021) |
| Alaska | $6,617 |
| Connecticut | $6,052 |
| New Jersey | $5,995 |
| District of Columbia | $5,949 |
| Maryland | $5,911 |
At the other end of the scale is Iowa. At $4,285, the Hawkeye State’s mean credit card debt per capita is the country’s lowest and, along with Wisconsin ($4,329), a near outlier. Kentucky, Maine, and Mississippi round out the bottom five, all with less than $4,600 in credit card debt per person.
States With the Lowest Credit Card Debt
| State | Average Credit Card Debt (Q3 2021) |
| Iowa | $4,285 |
| Wisconsin | $4,329 |
| Kentucky | $4,408 |
| Mississippi | $4,449 |
| Maine | $4,538 |
Why aren’t credit card balances about the same in each state? Two simple factors play an outsize role:
- Cost of Living. In the top five states for credit card debt, the cost of living index is higher than the national baseline of 100: Alaska (125.5), Connecticut (115.4), Virginia (102.4), New Jersey (114), District of Columbia (153.4), Maryland (124.1). Higher cost of living means higher spending and more reliance on debt.
- Household Income. 2021 median annual household income exceeds $80,000 in all five of the top states for credit card debt. That’s well above the national median of $70,784. As we’ll see, higher-income consumers can afford to carry higher credit card balances — and do.
Average Credit Card Debt By Income
Average credit card debt increases with income.
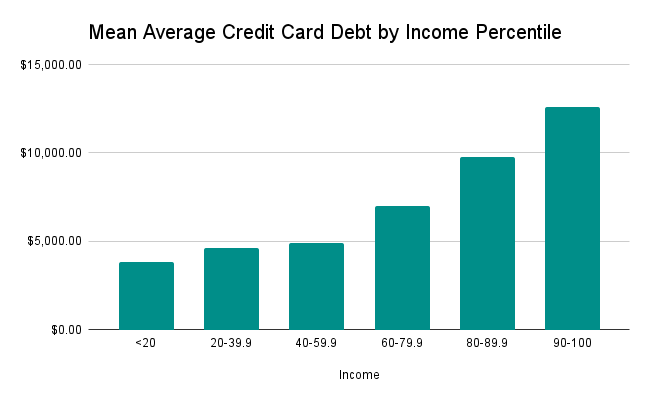
The mean credit card debt balance rises from $3,830 for the bottom 20% of households by income to $12,602 for the top 10% of households by income. Median credit card debt follows a similar track, rising from $1,100 for the bottom 20% to $6,000 for the top 10%.
The percentage of households with any credit card debt at all shows a different relationship. 30.5% of households in the bottom 20% carry credit card debt. A similar proportion (32.2%) carry credit card debt in the top 10%.
In the middle, credit card debt is much more common. 55% and 56.8% of households, respectively, carry credit card balances in the 40th to 59th and 60th to 79th percentiles.
| Income Percentile | Mean | Median | Percentage Who Carry Debt |
| <20 | $3,830.30 | $1,100.00 | 30.5% |
| 20-39.9 | $4,648.94 | $1,900.00 | 45.6% |
| 40-59.9 | $4,910.90 | $2,400.00 | 55.0% |
| 60-79.9 | $6,992.85 | $3,600.00 | 56.8% |
| 80-89.9 | $9,775.36 | $5,000.00 | 45.9% |
| 90-100 | $12,602.13 | $6,000.00 | 32.2% |
It might seem surprising that higher-income folks have higher average credit card balances. With more disposable income, they should find it easier to pay off their charges in full each month — right?
The reality is more complicated:
- Higher-Income People Qualify for Higher Credit Limits. Average credit score rises quickly with income. There’s a 147-point FICO score gap between people earning under $30,000 per year and people earning $50,000 to $75,000. Even more importantly, income is a key factor in issuers’ credit limit decisions. People with higher incomes can afford higher monthly payments, so they qualify for higher credit limits.
- They Have More Capacity to Carry Debt Too. Not everyone who qualifies for a high credit limit uses it — or carries a balance at all. But higher-income people who do carry balances can do so without causing cash flow problems.
- Their Discretionary Expenses Are Higher As a Share of Household Income. Higher-income households spend proportionately less on essentials like housing and transportation. That leaves more cash to put toward travel, home improvements, and other discretionary purchases. Often, these purchases wind up on credit cards with carried balances.
On the middle and lower rungs of the income ladder, we see that:
- Most Middle-Income Households Use Credit Cards to Get By. A clear majority of middle-income households rely on carried credit card balances. These households spend a significant portion of after-tax income on housing and other essentials, leaving little for discretionary spending.
- Many Lower-Income Households Don’t Qualify for Credit Cards (Or Only Qualify for Very Small Credit Lines). Two factors are at play here. First, credit card issuers know that lower-income people have less capacity to repay credit card charges, so they keep approved credit lines small (if they approve them at all). And second, remember the FICO score gap: Lower earners have much lower credit scores and thinner credit overall compared with middle- and upper-income folks.
- A Significant Fraction of Lower-Income Households Have Severe Credit Card Debt. Lower-income consumers who do qualify for credit cards are more likely to be severely debt-burdened. The mean credit card balance for the bottom quintile ($3,830) is 13.7% of the quintile’s maximum 2022 income ($28,002). The mean credit card balance for the top decile ($12,602) is just 5.9% of its minimum 2022 income ($212,110).
Average Credit Card Debt By Race & Ethnicity
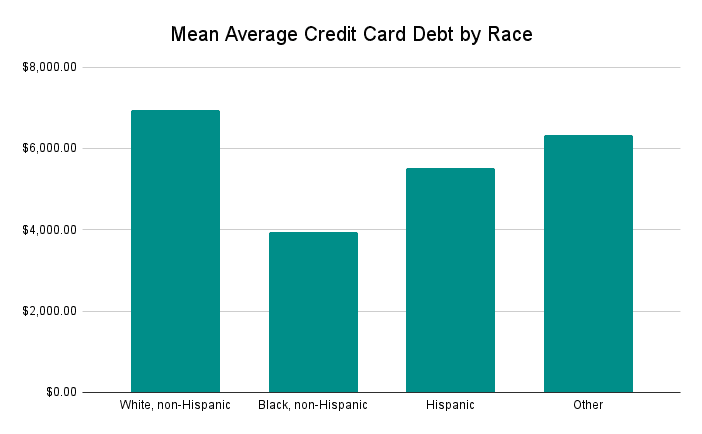
On average, non-Hispanic white consumers have significantly more credit card debt than other racial and ethnic groups: a per-capita mean of $6,936 and a per-capita median of $3,200.
Non-Hispanic Black consumers have per-capita mean credit card debt of $3,939 and median credit card debt of $1,300 per person. The numbers for Hispanic consumers of any race are $5,507 and $1,900, respectively.
Black and Hispanic consumers of any race are more likely to carry credit card balances, however: 47.7% of Black non-Hispanic consumers and 49.9% of Hispanic consumers of any race. 44.5% of white consumers carry credit card balances, along with just 43.7% of consumers of other races or more than one race.
| Category | Mean | Median | Percentage Who Carry Debt |
| White, non-Hispanic | $6,935.55 | $3,200.00 | 44.5% |
| Black, non-Hispanic | $3,938.71 | $1,300.00 | 47.7% |
| Hispanic | $5,507.22 | $1,900.00 | 49.9% |
| Other | $6,323.57 | $2,400.00 | 43.7% |
What does the data tell us about the relationship between race, ethnicity, and credit card debt? A few things:
- Credit Scoring Models Show Persistent Racial Gaps. In August 2021, the median white consumer had a FICO score about 100 points higher than the average Black consumer, according to the Urban Institute. The gap between white and Hispanic consumers was about 60 points. 41.4% of Black consumers had subprime credit scores, compared with 28.7% of Hispanic consumers and 16.5% of white consumers.
- Fewer People of Color Have Access to Credit at All. 15% of Black and Hispanic consumers have no credit history at all, compared with 9% of white and Asian consumers, according to the Consumer Financial Protection Bureau. A similar percentage are unscored, meaning they have some credit but not enough to generate a FICO score. They have very few credit card options — mostly high-interest, low-limit secured credit cards.
- Race and Ethnicity Correlate With Other Variables Affecting Credit Card Debt (And Access). For example, people who own their homes are more likely to carry credit card debt at all and have higher balances when they do. Only 43.3% of Black households and 51.1% of Hispanic households owned homes in 2020, compared with 72.1% of white households.
Average Credit Card Debt By Home Ownership
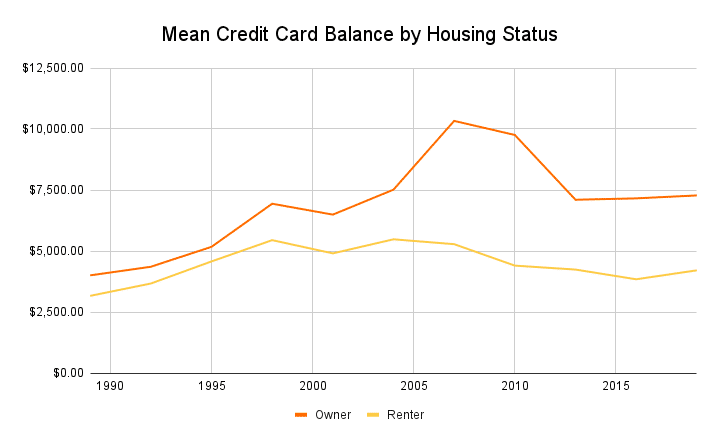
People who own their homes are more likely to carry credit card balances and have higher credit card balances overall.
47% of homeowners carry credit card balances, with a per-capita mean of $7,277 and a per-capita median of $3,400. 42.4% of renters have carried balances, with a per-person mean of $4,203 and a per-person median of $1,500.
Historically, homeowners’ credit card balances have been more volatile than renters’. Homeowner balances spiked relative to renter balances beginning around 2004 and remained elevated until the early 2010s. Renter balances slowly declined during the same period.
| Category | Mean | Median | Percentage Holding Debt |
| Owner | $7,277.00 | $3,400.00 | 47.0% |
| Renter or other | $4,203.00 | $1,500.00 | 42.4% |
Here’s what we can say about the relationship between homeownership and credit card debt:
- Home Equity and Credit Card Debt Have an Inverse Relationship. Over the past 20 years, homeowners’ credit card balances tended to increase when home prices fell and fall when home prices rose. Balances spiked during the housing crash of the late 2000s and slowly fell as home prices rose throughout the 2010s.
- Falling Home Equity Could Spell Trouble for Today’s Homeowners. Home prices are expected to remain flat or fall in 2023, according to CoreLogic. Some observers expect a more dramatic pullback. Should current homeowners see significant equity declines, we could see a repeat of the late 2000s, when homeowners levered up to offset the loss of real estate wealth.
- Some Renters Are Severely Debt-Burdened. The gap between the median and mean credit card balance is wider for renters (2.8x) than homeowners (2.1x). This suggests that most renters have relatively low credit card balances, a significant minority are severely debt-burdened. Debt-burdened renters are more likely to be lower-income and have high housing costs as a share of after-tax income.
Average Credit Card Debt By Education
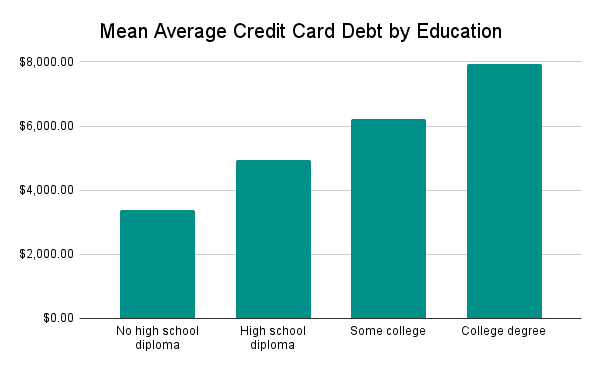
People with higher educational attainment tend to have more credit card debt.
The mean consumer with no high school diploma has $3,387 in credit card debt. The median high school nongraduate has $1,200.
By comparison, the mean college graduate carries a $7,941 credit card balance. The median college grad’s credit card debt load is $3,600.
People with more schooling are also more likely to carry credit card debt, up to a point. 32.4% of high school nongraduates carry credit card balances, against 51.7% of people who’ve completed some college. The percentage of Revolvers tails off for college grads, of whom 43.2% carry credit card balances. But college grads who do carry credit card debt have more, on average.
| Education | Mean | Median | Percentage Who Carry Debt |
| No high school diploma | $3,386.64 | $1,200.00 | 32.4% |
| High school diploma | $4,942.23 | $2,000.00 | 47.1% |
| Some college | $6,214.10 | $2,700.00 | 51.7% |
| College degree | $7,941.11 | $3,600.00 | 43.2% |
Beyond the headline — that college grads and dropouts tend to have more credit card debt — here’s what we can say about the relationship between card balances and education:
- People Without High School Diplomas Are Less Likely to Have Credit Cards, But More Likely to Be Debt-Burdened. Fewer than one in three high school nongraduates has a credit card, due in large part to income and credit score constraints. But the gap between the median and mean is higher for this group (2.8x) than for any other. That suggests the minority of high school nongraduates who do qualify for credit cards are likely to use them to make ends meet and may struggle to get out of debt.
- College Nongraduates Are Most Likely to Rely on Credit Cards. This echoes the pattern we see in our income analysis, where middle-income consumers are most likely to carry credit card balances. People who’ve completed some college tend to have higher incomes than high school graduates and lower incomes than college graduates.
- College Graduates Rely Less on Credit Cards Than High School Graduates. This finding also echoes our income analysis and likely correlates with higher homeownership rates in this demographic as well. With higher average incomes and more financial stability, college graduates have less trouble paying their credit card balances in full.
- College Graduates Have Higher Credit Card Balances Overall. College grads have the highest mean and median credit card debt of any educational cohort, at $7,941 and $3,600, respectively. This is also likely related to income: People who earn more tend to spend more on discretionary purchases, which often wind up on credit cards.
Credit Card Debt FAQs
You’ve seen the numbers and the trends behind them. Now, go beyond the statistics and find answers to some common questions about credit card debt — answers that could help you manage your own balances more effectively.
Should You Pay Off Your Credit Cards Each Month?
Yes, if you can. Credit card debt is among the most expensive kinds of nonpredatory debt — though some would argue that credit cards are in fact predatory.
Say your credit card’s interest rate is 18%. You make a single purchase of $1,000 this month, then lock your card in a drawer and never use it again. You make only the minimum payment each month (say, $35).
You’ll be debt-free in no time, right? Wrong. It’ll take you 38 months to pay off your balance, and your total payment will be $1,315.54, or $1,000 plus $315.54 in interest.
It’s not always that easy though. Emergencies happen. But if you must carry a credit card balance temporarily, do everything you can to pay it off as soon as possible.
Is Credit Card Debt Always Bad?
No, not always. If you don’t have enough money in your checking account to cover an emergency expense, a credit card could be your only option.
Plus, many credit cards offer 0% APR promotions that waive interest for new cardholders, sometimes for 18 months or longer. Pay off eligible purchases during the promotional period and you’ll avoid interest entirely.
But don’t get in the habit of carrying credit card debt at regular interest rates. You’ll end up paying far more than your original charge and could find it difficult to get out of debt at all.
How Much Credit Card Debt Is Too Much?
It depends on your personal financial situation. The higher your income, the higher the monthly credit card payment you can afford. So if you’re looking only through a cash flow lens, you only have “too much” credit card debt when you can no longer keep pace with the monthly minimum payments.
But you shouldn’t only — or even primarily — evaluate credit card debts through a cash flow lens.
It’s much more important to think about the total cost of your credit card debt and what that means for your finances over the long term. Credit card interest rates are really high, with even low-interest credit cards charging 15% APR or higher. At 15% APR, unpaid balances grow by 1.25% each and every month, far above the inflation rate.
You’re not going to outrun that by parking your money in a high-yield savings account or investing in the S&P 500. At least, not in the long run.
So our take is, any credit card debt is too much. Don’t charge more on your credit cards than you can afford to pay off in full each month. And if you absolutely must rack up credit card debt in an emergency, make a plan to pay it off as quickly as you can.
Are Credit Card Rewards Worth More Than Interest?
Regular credit card rewards are almost never worth more than credit card interest. Under normal circumstances, credit cards accrue interest on balances much faster than they accrue rewards points or cash back on spending. Meaning you can’t rely on rewards to keep you ahead of your interest payments.
The most common exception to this rule concerns sign-up bonuses, which promise rewards worth hundreds or even thousands of dollars to cardholders who clear predetermined spending thresholds in the first few months their accounts are open.
An example: The Chase Sapphire Reserve Card’s sign-up bonus is worth $900 when redeemed for travel. It requires $4,000 in eligible spending during the first 3 months. At a theoretical interest rate of 20%, that $4,000 balance earns $200 in interest during the same period. So you’ll still net $700 from the bonus, and actually a bit more after accounting for your minimum payments.
The longer you wait to pay off that balance, the smaller your net gets (and quickly). Which is why — broken record — it’s so important to pay off your credit card balances as quickly as possible.
Does Applying for a Credit Card Hurt Your Credit Score?
Yes, temporarily.
Of all the factors that affect your credit score, this one isn’t particularly important, but it’s still important to watch. The more new credit accounts you apply for, the bigger the hit your score takes. A single application might cost you a few points, while three or four applications in the space of a month might subtract 20 or 30 points from your score.
The good news is that the negative credit score impact of applying for a new credit card is temporary if you use credit responsibly otherwise. A consistent pattern of timely payments and low credit utilization (balances under 30% of your total credit line across all active cards) are both much more important factors.
What Does It Mean to Be Delinquent on a Credit Card?
If you don’t make the minimum payment on your credit card within 30 days of the payment due date, your account is delinquent. The issuer can and probably will report the delinquency to the major credit bureaus.
If 90 days pass without a payment, your account is seriously delinquent. The issuer may close your account and send the balance to a collection agency.
Payment history gets more weight than any other factor in credit scoring algorithms, so even one delinquency has a significant negative impact on your credit. Avoid missing credit card payments at all costs.
What’s the Best Way to Pay Off Credit Cards?
There’s no single “best” way to pay off your credit card debt. The three most common methods are:
- Debt Snowball. You make the minimum payments on all your credit card balances except the smallest one. You then throw every spare dollar toward that debt each month until it’s paid off. Rinse and repeat with the next smallest debt, then the next smallest one after that, and so on until you’re debt-free.
- Debt Avalanche. You make the minimum payments on all your balances except the highest-interest one, which you throw every spare dollar at until it’s paid off. Repeat with the next highest-rate debt, and the next, and the next, and — you get the idea.
- Debt Snowflake. You throw every bit of extra cash you have at your credit card balances. This includes discretionary cash left over after covering essential monthly expenses (housing, food, and so on) and any windfalls you receive during the course of the year, like a tax refund or performance bonus at work.
Debt snowballing and debt avalanching are mutually exclusive. You only do one at a time, though you can switch between them if the first doesn’t work as well as you’d hoped.
Debt snowflaking is complementary. You can (and should) use it to accelerate your debt payoff schedule even if you’re snowballing or avalanching. Whenever you receive a windfall, put it toward your credit card balances.
Final Word
Americans are racking up more credit card debt after a short, sharp drop during the COVID-19 pandemic. Amid persistent inflation and a looming economic downturn, per-capita credit card balances will probably continue to increase in 2023.
That’s the headline. But our analysis reveals that deeply rooted structural forces and longer-term trends shape credit card debt in America as well:
- A significant wealth gap among older Americans, with high-net-worth retirees largely debt-free and low-net-worth retirees severely burdened by debt
- Persistent racial disparities in credit scoring models that reduce nonwhite consumers’ access to credit
- A tendency for homeowners to lean on credit cards to make up for declining home equity — a key trend to watch if home prices fall significantly in the coming years
- Higher reliance on carried credit balances among middle-income households, compared with lower- and upper-income households
At a population level, we expect these trends to persist for the foreseeable future. But at the individual level, the picture is brighter. Live within your means and use credit responsibly, and you’ll find yourself in control of your financial destiny.